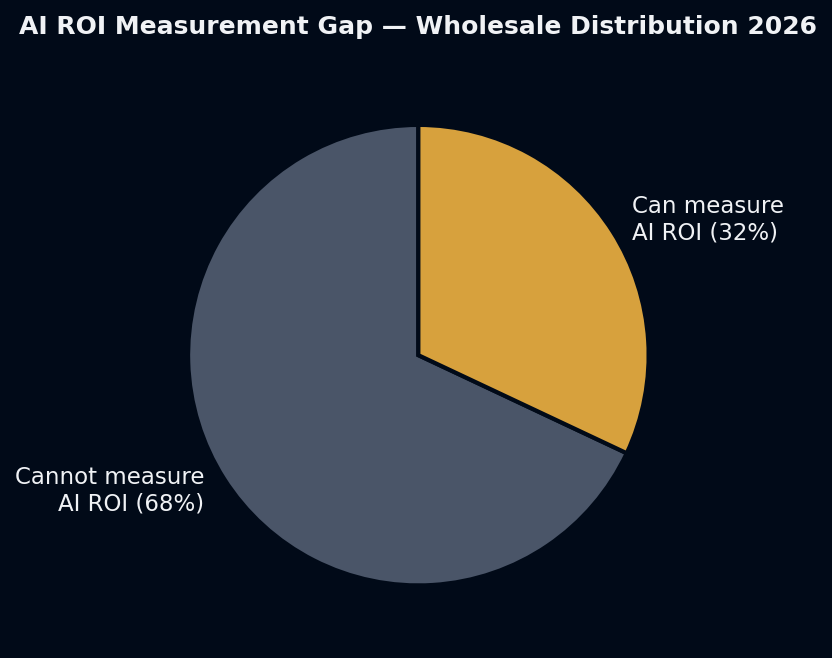
68% of wholesale distributors running AI cannot measure its ROI. They’ve deployed the tools, they believe they’re working, but they don’t have numbers that prove it (Applied AI for Distributors 2026).
This is not a data problem. The data exists inside every AI-enabled operation — ticket volumes, resolution rates, order exception counts, processing times. The problem is that nobody established what these numbers looked like before the AI went live. Without a before, there is no comparison. Without a comparison, there is no proof.
The fix is not complicated. It’s four metrics, established as baselines before go-live, tracked weekly after.
Why the Measurement Gap Exists
There are three consistent patterns across organizations that cannot measure AI ROI:
Pattern 1 — The tool was bought under a technology budget, not an operations budget. Technology purchases often don’t require ROI justification at the same threshold as operational expenses. The tool gets purchased, deployed, and absorbed into the software line without any expectation of measurement.
Pattern 2 — Deployment happened without baseline capture. The team rolled out the AI over a weekend. Monday morning, the AI was live. Nobody pulled the previous six weeks of ticket data to establish what the baseline resolution rate, average handling time, and cost per query looked like before. The baseline is now inaccessible.
Pattern 3 — Volume metrics got tracked instead of unit economics. The monthly report says “the AI handled 1,200 tickets this month.” That’s a volume metric. The ROI metric is “the AI handled 1,200 tickets at €1.50 each vs. the human baseline of €9 each, saving €9,000 this month.” Volume without a cost denominator is not ROI.
The Four Metrics
Metric 1 — Resolution Rate
Definition: Percentage of inbound queries fully resolved by AI without human escalation.
Industry benchmark: 65–70% for a well-configured B2B support implementation (Gleap, 2026).
How to measure: Pull from your AI tool’s analytics dashboard. “Resolved” means the customer received an answer and did not escalate. “Escalated” means the AI transferred to a human.
Baseline step: Before AI go-live, track your human team’s “first-contact resolution rate” — the percentage of queries resolved without requiring a second contact. This becomes your human baseline to compare against.
Metric 2 — Cost Per Query
Definition: Total support cost divided by total query volume, for a given period.
How to calculate: (Support team time in hours × hourly rate + AI tool monthly cost) ÷ total query count.
Benchmark gap: Human support: €6–€12 per query (depending on query complexity and handling time). AI support: €1–€2 per query at scale.
Baseline step: Pull the last 3 months of support team hours and query volume. Calculate the cost per query. This is your pre-AI baseline.
Metric 3 — PO Exception Rate (for order entry AI)
Definition: Percentage of AI-processed purchase orders that require manual correction before entering the ERP.
Target: ≤5% for a mature implementation with clean ERP data.
Why it matters: At >5% exception rate, the AI is creating more work than it saves — each exception requires a human to investigate, correct, and reprocess. At <5%, the throughput gain is real.
Baseline step: Before AI order entry, track the manual order entry error rate — the percentage of manually-entered orders that required correction. Compare this to the AI exception rate post-go-live.
Metric 4 — First-Response Time
Definition: Time from customer query submission to first substantive response.
Human benchmark: 10–20 minutes median for a staffed B2B support desk during business hours.
AI benchmark: Under 30 seconds for standard queries.
Why it matters for B2B: First-response time affects customer perception of reliability. B2B buyers who get order status in 20 seconds vs. 15 minutes experience the same supplier differently — even if the information is identical.
The Baseline Capture Protocol
One week before AI go-live:
- Export all support tickets from the past 90 days with: timestamp, query category, resolution status, handling time, agent assigned.
- Calculate: average handling time per category, resolution rate, cost per query (using your team’s fully-loaded hourly rate).
- Document in a single spreadsheet: “Pre-AI baseline — [date].”
- Set a 30-day review date after go-live to compare.
Total time: 2–3 hours. This is the step that makes the ROI case possible 30 days later.
What to Do If You Already Deployed Without a Baseline
The baseline is not entirely lost. You can reconstruct a partial baseline from:
- Historical ticket data (if your tool has history from before the AI was active)
- Team time records from the pre-AI period
- Invoices or labor reports from the period before deployment
A reconstructed baseline is less clean than a planned one, but it’s better than no baseline — and it’s usually sufficient for an internal ROI case.
The measurement framework is not about justifying the tool to a CFO (though it does that). It’s about running the tool correctly. Organizations that track these four metrics close the 68% measurement gap — and find the specific configuration improvements that push resolution rates from 40% to 65%.
AHoosh builds the measurement framework alongside the implementation. ahoosh.ai/contact