
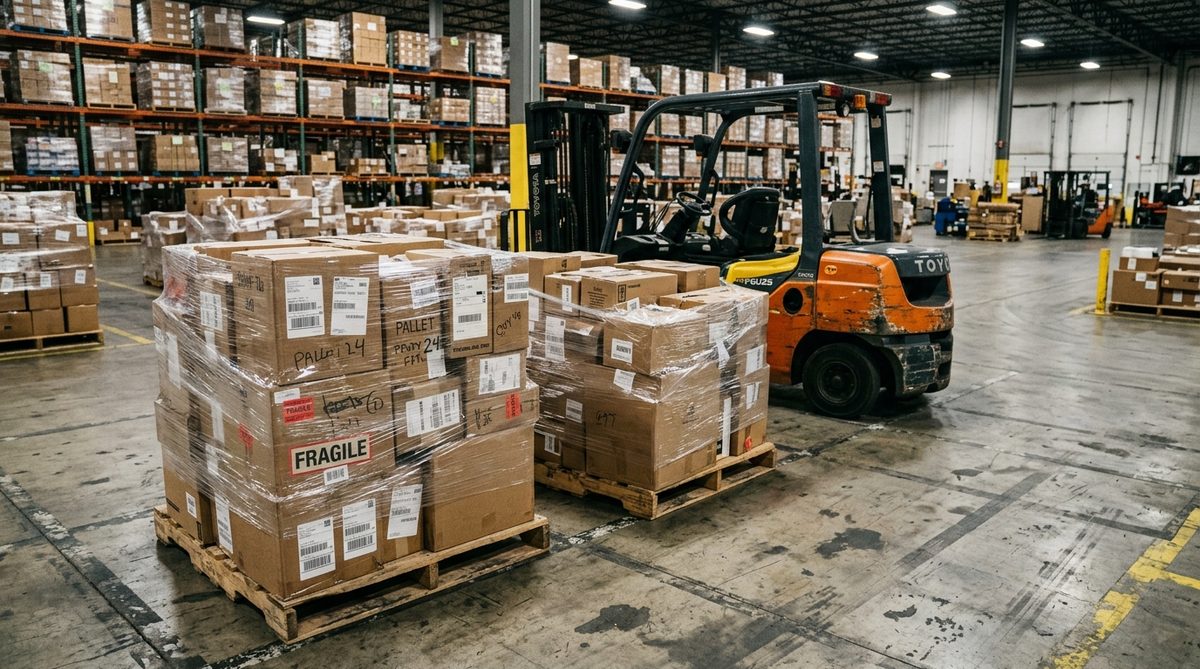
A small distributor lives on a knife-edge between two expensive mistakes. Order too much and cash sits frozen in a warehouse, some of it slowly going obsolete. Order too little and you stock out, lose the sale, and sometimes lose the customer to whoever had the item in stock. Most small distributors manage this with a mix of gut feel, a spreadsheet, and the memory of the person who has been doing purchasing for years. That works until it does not — a demand spike, a supplier delay, or that person taking a holiday.
“AI demand forecasting” gets pitched as the fix, and it can genuinely help. But the pitch usually comes wrapped in enterprise software and data-science jargon that assumes resources a small distributor does not have. The useful truth is narrower and more encouraging: even simple, well-applied forecasting beats gut feel, you can start with data you already have, and the “AI” part is often a modest layer on top of solid basics rather than a machine-learning moonshot.
This guide covers what demand forecasting actually requires at small scale, which methods earn their keep, how AI fits in honestly, and how to start without hiring a data team.
Get the Data Foundation Right First
Forecasting is only as good as your sales history.
Before any method or tool, you need clean historical demand data. The minimum useful foundation is per-product sales history over time — ideally two or more years to capture seasonality, though even one year is a start. For each product, you want to know how much sold in each period (week or month), not just totals.
The data that improves a forecast:
- Sales quantity per product per period — the core input
- Stockout periods — critical and often missed. If you sold zero of an item because you had none, that is suppressed demand, not low demand. Forecasting on raw sales without flagging stockouts teaches the model that demand was low when it was actually unmet
- Promotions and price changes — a spike caused by a discount is not baseline demand
- Lead times per supplier — how long between ordering and receiving, because the forecast has to cover that gap
- Known future events — a big customer’s planned expansion, a seasonal peak, a trade fair
Clean before you model.
The unglamorous truth: most forecasting improvement at small scale comes from cleaning the data, not from a fancier algorithm. Deduplicate products (the same SKU entered three ways), flag stockouts, separate promotional spikes, and get the history into one consistent table. This is the same clean-order-history foundation that a CRM for a small distributor depends on, and the two efforts reinforce each other.
Where the data lives.
For most small distributors it lives in accounting or inventory software (Xero, QuickBooks, Odoo, an ERP) and can be exported to a spreadsheet. You do not need a data warehouse to begin — a well-structured export is enough to start forecasting.
Which Methods Actually Help at Small Volume
Start simpler than you think you need.
There is a hierarchy of forecasting methods, and small distributors often benefit most from the lower rungs done well, before anything labeled AI.
- Moving average. Average of recent periods. Crude but a real baseline, and better than pure guesswork for stable products
- Exponential smoothing. Weights recent data more heavily; handles trend and seasonality (Holt-Winters) and is genuinely useful for products with seasonal patterns. This alone covers a large share of a distributor’s catalog
- Seasonal decomposition. Separates a product’s demand into trend, seasonal pattern, and noise, so you can see and project each. Very informative for products with clear seasonality
- Machine-learning forecasting. Models that learn patterns across many products and external variables. Powerful, but they earn their advantage mainly when you have lots of products, long history, and external signals to feed them
Match the method to the product.
Not every product needs the same approach. A high-volume, steady seller forecasts well with exponential smoothing. A lumpy, intermittent product (sells in unpredictable bursts) needs a different treatment (intermittent-demand methods) and often more safety stock rather than a precise forecast. Segment your catalog by demand pattern and volume, and apply effort where it pays — the top products by value deserve the most attention.
Where AI genuinely adds value.
AI/ML forecasting outperforms simpler methods most clearly when there are patterns a human cannot easily see: interactions between products, weather effects, correlations with external indicators, or complex seasonality across a large catalog. For a distributor with thousands of SKUs, an ML model that forecasts all of them consistently and incorporates external signals can beat a spreadsheet that only the purchasing manager fully understands. For a distributor with fifty products, good exponential smoothing may match it. The mechanics and the honest limits are covered in more depth in AI inventory forecasting for B2B distributors.
How to Start Without a Data Team
You have three realistic paths.
- Spreadsheet plus formulas. Exponential smoothing and moving averages are just formulas. A capable person can build a forecasting spreadsheet that covers the core catalog for the cost of a few days’ work. This is the right starting point for many small distributors and teaches you what good looks like before you buy anything
- Inventory software with built-in forecasting. Many inventory and ERP tools (including modern cloud ones) now include demand forecasting and reorder-point features. If your stock already lives in such a tool, turn on and tune the forecasting it already offers before buying something separate
- Dedicated forecasting/inventory-optimization tools. A category of affordable tools (Inventory Planner, Netstock, and similar) sits on top of your sales data and produces forecasts and reorder recommendations, often with ML under the hood, priced for small businesses
Use general AI tools for the analysis, carefully.
You can also use general-purpose AI assistants to help interpret your data — spotting seasonality, drafting the spreadsheet formulas, explaining an anomaly — without handing them the whole operation. Treat their output as a draft a human checks, not an oracle. This kind of assisted analysis is one of the practical uses in AI tools for a B2B workflow.
Set reorder points, not just forecasts.
A forecast is only useful when it drives a decision. Translate forecasts into concrete reorder points: reorder level = expected demand over the lead time + safety stock. Safety stock covers the uncertainty — more for lumpy or critical products, less for steady ones. The forecast feeds this formula; the reorder point is what actually protects you from stockouts.
Measure forecast accuracy and improve.
- Track how far off your forecasts were (compare forecast vs. actual each period)
- Look for systematic bias — always over- or under-forecasting a product category signals a fixable pattern
- Improve the worst-performing, highest-value products first
- Accept that forecasting reduces error, it does not eliminate it — the goal is better decisions, not a crystal ball
Keep Humans in the Loop
A forecast is an input to judgment, not a replacement for it.
The purchasing person who knows a big customer is about to expand, or that a supplier is unreliable this quarter, holds information no model has. The best setup combines a solid statistical or AI forecast with human override for known events. Let the model handle the routine hundreds of products; let the human adjust for the handful of things they know that the data does not.
Guard against the two failure modes.
- Blind trust. Following a forecast off a cliff because “the model said so” when a human could see the demand spike was a one-off promotion. Always sanity-check large recommendations
- Blanket dismissal. Ignoring the forecast entirely and reverting to gut feel, which throws away the value. The discipline is to override for specific known reasons, not by default
The payoff is cash and service level together.
Better forecasting lets a small distributor hold less inventory (freeing cash) while stocking out less often (keeping customers). Those usually trade off against each other; a good forecast is what lets you improve both at once. That freed cash and improved reliability feed directly into the retention economics behind recurring revenue and loyalty for distributors.
AI demand forecasting for a small distributor is less exotic and more achievable than the enterprise pitch suggests. The order of operations is clean data first, the right method matched to each product’s demand pattern second, and AI as a layer that earns its place mainly on larger catalogs and hidden patterns. Start with a spreadsheet or your existing inventory tool’s built-in forecasting, translate forecasts into reorder points, and keep a human in the loop for what the data cannot see.
Done this way, forecasting is not a data-science project — it is a discipline that steadily replaces gut feel with evidence, frees cash trapped in overstock, and stops the stockouts that quietly cost you customers. Begin with your best-selling products, prove the value, and expand from there.
Sources: Odoo — inventory and forecasting documentation · European Commission — SME digitalisation