
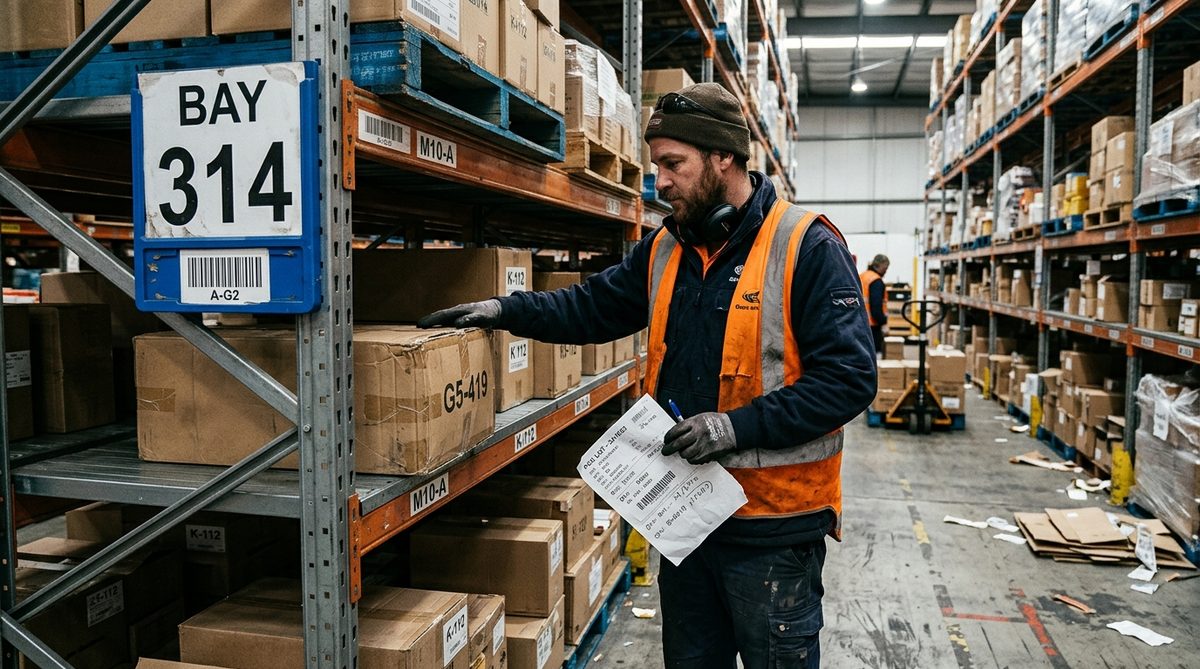
Almost every small distributor’s warehouse layout is an accident. Not a bad decision — an accident. The first racking went in where the door was. The second batch of stock went in the empty space next to it. Five years later, the fastest-moving item in the catalogue sits at the back of aisle six on the top shelf, because that is where there was room in 2021, and nobody has moved it since because moving it is a Saturday and there is never a Saturday.
The cost of that accident is not visible on any report. It shows up as pickers walking, as orders taking four hours instead of two, as a warehouse that “needs more space” when it actually needs the same space arranged differently. For a distributor with 800 SKUs and three people in the warehouse, the difference between an accidental layout and a deliberate one is routinely 20–30% of picking time — which is to say, roughly one full salary.
This is how to fix it without buying a WMS, without new racking, and without a consultant walking around with a clipboard. It takes one afternoon of analysis and two weekends of moving things.
Start With the Data You Already Have — Velocity Analysis
The only export you need.
Pull one report from whatever system you use — ERP, accounting package, even the order spreadsheet: every order line for the last twelve months, with SKU, quantity, and date. That is it. No cost data, no margin, no supplier. Just what got picked, how often. If your order history is fragmented across email and spreadsheets rather than one system, fix that first; the same order table that makes a minimum viable CRM work is the table this analysis runs on.
Then compute one number per SKU: pick frequency — how many separate order lines that SKU appeared on. Note that this is deliberately not units sold. A SKU sold 10,000 units in four orders is a slow mover from a picking perspective. A SKU sold 400 units across 380 orders is your busiest item in the building. Layout optimisation is about trips, not volume.
The distribution you will find.
Sort descending by pick frequency and you will almost certainly see the standard shape:
- The top 10–15% of SKUs account for roughly half of all pick lines
- The next 25% account for another 30%
- The bottom 50–60% of SKUs account for under 10% of picks — some have not been picked once in a year
Give them names: A (top ~15%), B (next ~25%), C (the long tail). Then add one column that almost nobody adds: last pick date. Any SKU whose last pick date is more than twelve months ago is not slow-moving stock. It is dead stock occupying prime real estate, and it is the first thing to move.
The reality check before you move anything.
Walk the building with the A-list printed out and mark on a rough floor sketch where each A item currently lives. In an accidental layout, you will find the A items scattered across the entire footprint, because they were never placed — they accumulated. That sketch is your business case. You do not need a study; you need the sketch.
The Golden Zone — Vertical Placement Before Horizontal
The cheapest win in the building.
Before you move a single item to a different aisle, fix height. The golden zone is the band between roughly knee and shoulder height — call it 75cm to 150cm. An item picked from the golden zone takes a fraction of the time of an item picked from floor level or from above shoulder height, and it does so without bending, without a step ladder, and without the injury risk that comes with both.
The rule is simple and it costs nothing but labour:
- A items → golden zone, always, without exception
- B items → the band immediately above and below the golden zone
- C items → floor level and top shelves, where the extra seconds per pick are multiplied by almost nothing
Most small warehouses have their A items on top shelves and their dead stock at waist height, because the dead stock arrived first. Reversing that, aisle by aisle, is typically the single highest-return change available and requires zero capital.
The safety dimension is not optional.
Repeated bending and overhead lifting is the primary source of warehouse injury in small operations, and in the EU it is a regulated matter, not a preference — manual handling of loads sits under Directive 90/269/EEC, and the general employer duty to assess and reduce risk sits under the framework directive above it. EU-OSHA publishes the practical guidance. Velocity slotting is, conveniently, also the ergonomics fix: the items your team touches forty times a day are the ones that end up at waist height.
Travel-Path Analysis — Where the Hours Actually Go
Picking time is mostly walking.
In a manual pick operation, the breakdown is consistently something like: walking 50–60%, searching 10–15%, actual picking 15–20%, paperwork and staging the rest. That means the layout question is really a walking question. Reducing the physical handling time by 10% is nearly invisible. Reducing walking by 30% is a different business.
The measurement, done crudely.
You do not need a simulation package. Take your twenty most recent multi-line orders. For each, trace the route on your floor sketch in the sequence the picker actually walks it. Measure the total distance roughly, in strides. Two things will jump out immediately:
- Backtracking — the route crosses itself, because item 3 on the pick list is in aisle 2 and item 4 is in aisle 7 and item 5 is back in aisle 2.
- The dead leg — one long walk to a far corner for a single low-frequency item that appears on many orders anyway (packing tape, a common adapter, a consumable).
Both are fixable without moving racking.
Three fixes, in order of payback.
- Sequence the pick list to match the physical layout. This is a sorting change in your order printout, not a warehouse change. If your pick list prints in SKU-code order, your picker is walking a random route. Print it in location order. This alone frequently removes a third of walking distance and costs one afternoon of configuration.
- Duplicate the consumables. If packing tape appears on the route to nowhere, buy a second roll and put it in a second location. The cost of a duplicate low-value item is trivially less than the cost of walking to it 600 times a year.
- Adopt a U-shape flow. Receiving on one side of the door, the fast-moving A zone directly in front of the packing bench, B behind it, C at the far end, dispatch back at the door. Goods in and goods out share the door area; picking radiates outward by velocity. For small footprints this beats a straight-through flow almost every time, because it shortens the average round trip.
Zone Design and the Two-Bin Slot
Fixed slots, not chaotic storage.
Large operators use chaotic (random) storage because their WMS knows where everything is. You do not have a WMS, so your team’s memory is your WMS — and memory needs fixed locations. Every SKU gets one home. Label it: aisle-bay-level, e.g. A-04-2. Print the location on the pick list. New staff become productive in days rather than weeks, and “searching” collapses from 15% of the day to near zero.
The two-bin technique for A items.
For your top thirty or so SKUs, run two locations: a small pick bin in the golden zone and a bulk location on the top shelf or in the C zone. Pickers only ever touch the pick bin. When it empties, a replenishment task refills it from bulk. This does two things at once — it keeps your highest-frequency items permanently at optimal height regardless of case size, and it makes stockouts visible physically rather than only in the system.
Reserve a “new and unknown” zone.
Every warehouse needs a defined space for stock whose velocity you do not yet know — new lines, sample stock, a supplier trial. Without a defined zone, new stock lands wherever there is room, which is how the accidental layout regenerates itself. Give it a bay, review it quarterly, and slot the items properly once they have a pick history.
Feed the layout back into forecasting.
The velocity classification you just built is the same classification your replenishment logic should use. A items get tight reorder points and frequent review; C items get generous reorder points and quarterly review. If you are already using demand data for stock decisions — the approach in AI inventory forecasting for B2B distributors — the slotting data and the forecasting data are the same dataset viewed from two angles. Build it once, use it twice.
Making the Change Stick
Do it in waves, not in one weekend.
The all-at-once relayout fails, reliably. Your team loses their spatial memory overnight, picking accuracy collapses for two weeks, and someone declares the project a mistake. Instead:
- Wave 1 (one weekend): Move dead stock out of the golden zone. Nothing else. Immediate improvement, near-zero disruption, because nobody was picking that stock anyway.
- Wave 2 (one weekend): Move the top 30 A items into the vacated golden-zone space near packing. This is where most of the gain lands.
- Wave 3 (spread over a month, an hour a day): Reslot B items, label all locations, update the pick-list print order.
Measure two numbers, before and after.
- Average lines picked per hour, per person. This is your productivity number and it should move within one wave.
- Order cycle time — order received to order staged. This is the number your customers experience.
Take both for a normal week before you touch anything. Without a baseline you will spend the next year arguing about whether it worked.
Re-slot quarterly, not never.
Velocity drifts. A seasonal item that was an A in November is a C in March. Once a quarter, re-run the pick-frequency export, compare the new A-list to the current golden-zone contents, and move the delta. It is usually twenty SKUs and two hours. Skipping this for two years is how the accidental layout comes back.
The reason this work gets postponed is that it has no invoice attached. Nobody sells you a warehouse layout, so nobody calls you about it, so it never enters the queue. But it is one of the few operational changes available to a small distributor with a return measured in weeks and a capital cost of roughly zero — a data export, a floor sketch, a pick-list sort order, and two weekends of moving boxes. The building you already have is almost certainly big enough. It is just organised in the order the stock arrived rather than the order it leaves.
Sources: EU-OSHA · Directive 90/269/EEC on manual handling of loads